|
EAS, The Equity Analysis System is an integrated system for acquiring,
analyzing, charting, and creating reports of equity data. The system can perform
in depth end-of-day charting and Technical Analysis (TA), on current or
historical data of various financial instruments. EAS provides outstanding
charting and development capability for analyzing financial markets.
Charting Extras
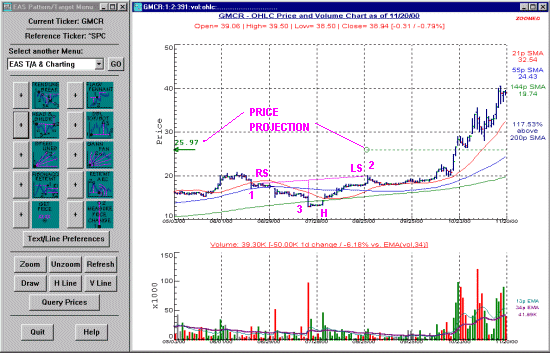
EAS has several "point & click" features that allow price data queries, the
drawing of trendlines, zoom/unzoom capabilities, text annotation and target
price establishment based on common chart patterns. Many future enhancements are
planned including trading system testing, stop price risk assessment and
portfolio management features. A sample price/volume chart is shown below.
Free Data
EAS was designed to be an inexpensive tool that interfaces with data that can be
downloaded from various locations on the internet at no cost. It can also
interface with other popular data formats such as Metastock ASCII files or comma
delimited (.csv) data set up in the proper format. This is a great advantage
since most commercial TA software requires a data download service and charges a
monthly subscription fee. A data service could also be used with EAS if one were
so inclined. The data would need to be translated into a format that EAS can
understand, however.
Technical Analysis Development
Aside from the standard charting features provided EAS can be used to create
unique TA chart studies utilizing the user's own thoughts and ideas on how price
and volume data could be manipulated and displayed. This requires a bit of
programming knowledge for more complicated analysis or for manipulating simpler
chart studies using some of the included functions. This is an exciting
capability since the TA field is constantly evolving and a trader or investor
needs to use the tools he or she is most comfortable with to make decisions. The
capability to create unique indicators opens up a whole new world of
experimentation. What better tool is there than one you as an investor/trader
fully understand because you created it! This capability has typically been
available only on high-end (i.e. expensive) trading platforms. EAS has been
designed from the ground up to be a useful tool. It can be as complicated as you
want to get or analysis can be as simple as a point and click away.
System Requirements
- Microsoft Windows NT, 2000, or XP
- O-Matrix version 5.2 or greater
|