NWA Quality Analystby Northwest Analytical
Quality Analyst is an SPC charting and analysis software solution providing the best combination of power, flexibility, and ease of use. It enables you to graphically analyze process behavior and judge the impact of process improvement decisions with minimal training in statistical techniques.
 NWA Quality Analyst is an award winning SPC charting and analysis software solution providing the best combination of power, flexibility, and ease of use of any SPC software available. It enables a wide range of users to graphically analyze process behavior and judge the impact of process improvement decisions with minimal training in statistical techniques. It integrates with all major manufacturing information systems. Quality Analyst is used by more than 5,000 manufacturers to analyze plant data for vendor certification, regulatory compliance, process improvement, and cost reduction. NWA Quality Analyst is an award winning SPC charting and analysis software solution providing the best combination of power, flexibility, and ease of use of any SPC software available. It enables a wide range of users to graphically analyze process behavior and judge the impact of process improvement decisions with minimal training in statistical techniques. It integrates with all major manufacturing information systems. Quality Analyst is used by more than 5,000 manufacturers to analyze plant data for vendor certification, regulatory compliance, process improvement, and cost reduction.
Ease of Use
Quality Analyst combines comprehensive charting and analysis capabilities with interactive operation to turn your data into valuable information. Developed for ease of use, Quality Analyst provides:
- Fast, simple charting—from start to chart in as few as three mouse clicks
- Simple, direct data and chart setup
- Multiple chart displays and printing with drag-and-drop page layout
- Easy, wizard-guided automation
- Straightforward connection to external databases
Flexibility
When it comes to setting up charts for specific analytical needs, Quality Analyst offers unmatched flexibility and versatility. User preferences can be set using clear, logical, consistent dialogs. While default settings produce the most commonly accepted form, charts can be quickly customized. You can define any chart to meet internal, customer, or regulatory requirements, for example:
- Combine attribute, measurement, and descriptive information in the same data set
- Select from more than 20 process capability indices and 8 distributions
- Select from 19 pattern and run rules, or create your own
- Choose fonts, colors, aspect ratios, and annotations to create presentation quality graphics
Power
Quality Analyst's operational power is available directly from the spreadsheetlike user interface, providing:
- Access to all configuration, charting, and analytical functions from a single screen
- A suite of advanced data management tools
- A robust data structure allowing all charting and analysis from a single data set
- User-defined calculated variables (including a visual equation builder), multi-key data sorting, and multicriteria data filtering
- Pop-up windows displaying descriptive characteristics and rule violations for any point on a chart
Automation
Automating the charting process is easy with Quality Analyst’s popular “Run file” (scripting) technology. Run files automate virtually all of Quality Analyst’s extensive capabilities. In addition to automatically creating SPC charts, users can select data variables and chart types, specify filter criteria, or even enter new data without running the full Quality Analyst product. While most users will create Run files using Quality Analyst’s built-in AutomationWizard, advanced users can create and modify Run file scripts with a text editor.
Integration
Quality Analyst integrates with all major manufacturing information systems to serve as the SPC analysis and charting component of an integrated quality information system. The combination of database connectivity and synchronization, Run File automation, and XML output provide the tools necessary to automatically collect, analyze, and report on data from virtually any source. Quality Analyst’s SPC analysis can be launched directly from desktop icons or from other applications. Database connection is automatic and users can be prompted to guide workflows and modify queries.
Database Connectivity
NWA Quality Analyst® connects to any ODBC-compliant database, providing an automatic link to applications built on databases such as Microsoft Access, SQL Server, Oracle, and DB2. Database connections are defined by using Quality Analyst’s step-by-step point-and-click configuration or by creating custom SQL queries.
You can create dynamic SQL queries that prompt the user for input parameters such as date ranges, product codes, or lot numbers. All SPC information, including control limit shifts, Assignable Cause/Corrective Action, chart comments, and tagged data is automatically synchronized with the appropriate database record. Quality Analyst can also be configured to automatically read product specifications from remote databases using the same connection process. This allows for seamless integration with information systems such as SCM, ERP, MES, LIMS, HMI/SCADA, or Historians.
Connecting a Quality Analyst Data Set to an external database is straightforward. The user interface lets you select the database, data table, data fields, and even filters using familiar point-andclick methods. For more complex databases, Quality Analyst can connect to views, queries, or stored procedures, or you can embed your own SQL statements in the Quality Analyst data definition.
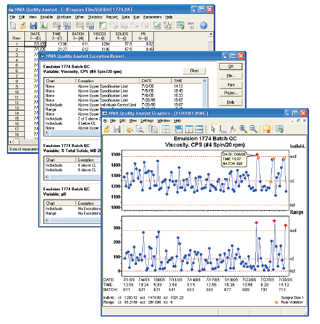
Exception Reporting
You can design any number of exception reports for each Data Set and provide a wide range of reports on SPC, specification, and pattern-rule violations.
The SPC chart associated with the exception is generated with the click of a button. In addition, you can combine multiple Exception Reports in Quality Analyst Run Files to produce a single report that scans quality data across a process or facility.
Assignable Cause/Corrective Action
Predefined Assignable Cause and Corrective Action text and ad hoc comments can be assigned to data points on any SPC chart. Multiple Assignable Cause/Corrective Action report formats plus Pareto analysis helps support quality initiatives and compliance programs such as Six Sigma, ISO, and CAPA.
|