 Tecplot 10by Tecplot
Plot and animate all your simulation and experimental data exactly the way you want. Arrange multiple XY, 2 and 3D plots in one layout, automate plotting tasks, and present your results with brilliant, high-quality output.
Version 10 marks a major milestone for Tecplot. The latest
release includes new capabilities in three key areas: plotting, data
managements, and the user interface.
These enhancements provide more control to explore, analyze and
communicate results.
|
New Features in Tecplot 10
| 01. Undo |
09. Multiple Contour Variables |
| 02. Variable & Node Map
Sharing |
10. 3-D Scatter Symbols |
| 03. Data Journaling |
11. Image Import |
| 04. Auxiliary Data |
12. Frame Linking Options |
| 05. Cell-Centered Data Options |
13. Improved Data Loaders |
| 06. Polar Plots |
14. Super Sampling Options |
| 07. RGB Color Flooding |
15. JPEG Export Options |
| 08. Specular Highlights |
16. Flash (SWF) Export Options |
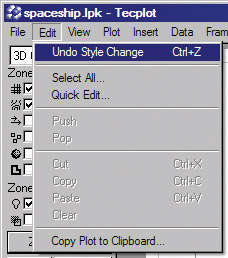
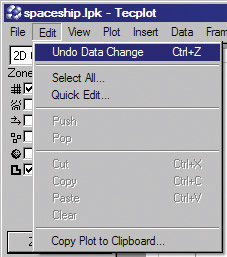
1. Undo
enables you to reverse view changes, style changes, and data operations
at a click of a button ? giving you freedom to explore and analyze your
data without hesitation.
2. Variable and Node
Map Sharing reduces memory usage and improves performance by
sharing variables and node maps between zones. Define one grid
definition for time-dependent and iterative solutions with non-moving
grids. This applies to structured and unstructured data.
3. Data Journaling
eliminates the requirement to save modified data files when writing out
layouts. Data alterations are saved in your layout file and applied when
the file is opened. View and modify data journaling commands in any text
editor.
4. Auxiliary Data
Options enable you to attach supplementary information (name/value
pairs) to data sets, frames, or zones. Auxiliary data can be read from
your data file or set by a macro or add-on. View auxiliary data from the
data menu, use in equations or display as dynamic text.
5. Cell Centered Data
Options make it possible to read and display cell-centered data
or a combination of mixed node and cell-centered data. Point objects
such as vectors and scatter symbols can be plotted at the cell center,
face center or node locations.
6. Polar Plot
Capabilities enable polar line plots. In this example: R=f(Theta).
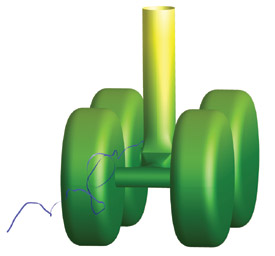
7. RGB Color Flooding
makes it possible to assign up to three variables to the red, green, and
blue channels. Use RGB color flooding with multi-phase and multi-component
flows to view concentrated and diluted regions.
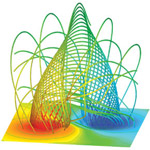
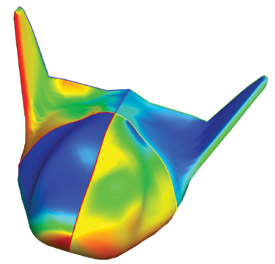
8. Specular Highlights
add realistic lighting to 3-D plots. Surface reflections provide a
better understanding of 3-D shapes.
|
9. Multiple Contour
Variable Features enable you to view and analyze multiple
variables at once. Assign different contour variables to different zones
or display multiple contours for a given zone. You can also display a
separate contour variable on iso-surfaces.
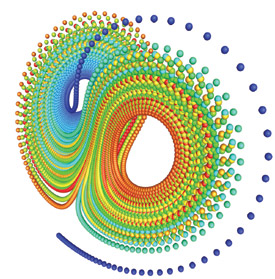
10. 3-D Scatter Symbols
enable you to display spheres and other 3-D shapes for symbols. Like all
symbols in Tecplot, you can size them proportionally to a specific
variable.
11. Image Import
allows logos and bitmapped images to be incorporated into your plots.
12. Frame Linking
Options provide more control between and within frames. Link
slices, iso-surfaces and other attributes between frames. Link axis
styles, grid line styles and Zone/Map attributes within frames. Save
time and generate your plots with less effort.
13. Improved Data
Loaders incorporating variable and node map sharing, auxiliary
data and cell-centered data capabilities into the PLOT3D, CGNS, and
Fluent loaders.
14. Super Sampling
Options create anti-aliased images that export with eye-pleasing
on-screen graphics. Anti-aliasing softens jagged edges making text easy
to read and objects appear to be smooth.


GIF with anti-aliasing GIF without anti-aliasing
15. JPEG Export Options
enable you to display continuous-tone images in HTML documents over the
Web and other online services. JPEG, a true color format, retains all
color information in an image while compressing file size by selectively
discarding data (lossy compression). To control lossy compression a
Quality slider is used.

16. Flash (SWF) Export
Options let you create high-quality, true color animations.
Tecplot?s Flash output is extremely flexible. You select movie width,
quality, size, speed and smoothness. Combined these options create
vivid, eye-pleasing graphics. Flash plays in QuickTime and other freely
distributed media players. Flash files can also be inserted and viewed
directly in HTML Web documents and MS PowerPoint.
|
|